





I remember my first research project vividly—survey data spread across spreadsheets, open-ended responses piling up, and me staring at it all wondering where to begin.
That experience taught me that mastering data analysis methods in research isn’t just about numbers or words—it’s about choosing the right tools to uncover meaningful insights.
By blending quantitative rigor with qualitative depth, researchers can turn raw data into actionable intelligence.
Quantitative Analysis: Measuring What Matters

Quantitative methods focus on numbers and statistical validation. In my projects, these methods are the first stop when handling structured datasets, like multiple-choice surveys or rating scales.
Descriptive Statistics
Descriptive statistics summarize data quickly. For instance, when I ran a survey on fitness app preferences, calculating the mean and median of user ratings helped me pinpoint popular features. Standard deviation highlighted which features had polarized opinions.
Frequency distributions showed which options were most selected, while cross-tabulations revealed patterns across age or income groups.
Inferential Statistics
Inferential statistics allow me to extend findings beyond my sample. T-tests and ANOVA help me compare groups—for example, seeing if younger users preferred gamified tracking compared to older users.
Correlation analysis revealed which engagement metrics moved together, while regression models predicted user satisfaction based on app usage frequency. Even chi-square tests showed me relationships between categorical variables, like device type and subscription choice.
These methods are powerful when working with primary and secondary data in research, letting me confidently test hypotheses and report statistically robust results.
Qualitative Analysis: Understanding the Why
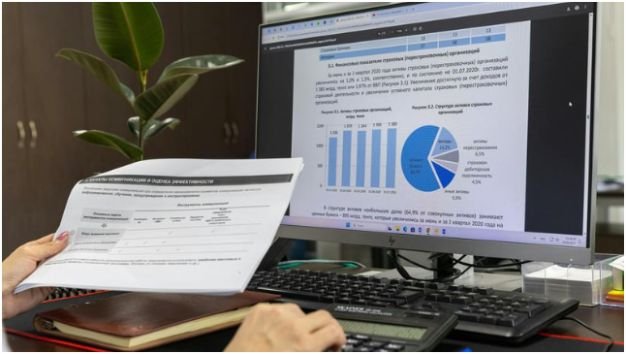
Numbers tell one story, but open-ended responses reveal the why behind user behavior. In every survey I’ve analyzed, qualitative insights add context that numbers alone can’t capture.
Content and Thematic Analysis
I categorize text responses to identify recurring words and themes. When evaluating customer feedback for a new app, thematic analysis highlighted recurring complaints about navigation. Content analysis quantified mentions of “bug,” “update,” and “ease of use,” providing evidence for prioritizing features.
Sentiment Analysis
Automated sentiment scoring is a game-changer for large datasets. Using tools to classify responses as positive, negative, or neutral allowed me to spot trends quickly—for instance, detecting frustration among trial users while subscription users expressed satisfaction.
Grounded Theory and Narrative Analysis
In exploratory projects, I’ve applied grounded theory to uncover patterns not previously considered. Narrative analysis of participant stories revealed motivations behind behavior, like why certain users abandoned a fitness plan despite high app engagement.
Discourse Analysis
Sometimes, the context behind language matters. Discourse analysis lets me understand communication patterns and power dynamics, which is crucial when studying organizational behavior or group surveys.
Survey-Specific Techniques

Surveys combine closed-ended questions and open-ended prompts, requiring a hybrid approach.
Quantitative Survey Methods
For structured survey questions, I rely on:
- Frequency Distribution: Identifies how many respondents chose each option.
- Cross-Tabulation: Compares two questions side-by-side to uncover relationships, like age versus feature preference.
- Chi-Square Test: Detects significant relationships between categorical variables.
- Correlation Analysis: Measures alignment of responses on rating scales.
Data Cleaning Essentials
Before analysis, I clean the dataset meticulously: removing incomplete responses, filtering speeders who answered too fast, handling missing data, and checking for straightlining where respondents pick the same option for every item. Skipping this step can distort results.
Software Tools
I use a mix depending on complexity:
- Qualtrics for premium, built-in analytics.
- SPSS for complex statistical models.
- Google Forms / SurveyMonkey for simple frequency charts.
- R / Python for custom analyses, modeling, and large datasets.
Mixed Methods: Triangulating Insights
Triangulation combines quantitative and qualitative approaches to validate findings. For instance, in a recent fitness survey, I correlated high satisfaction ratings (quantitative) with positive comments about usability (qualitative). This dual confirmation increased confidence in the recommendations I presented to the product team.
Using mixed methods ensures no insight slips through the cracks. Numbers reveal trends; words reveal motivations. Together, they provide a complete understanding.
Key Takeaways From Experience
- Quantitative methods provide objectivity, patterns, and predictive power.
- Qualitative methods offer context, motivation, and depth.
- Data cleaning is as important as analysis—dirty data misleads decisions.
- Mixed-method approaches enhance accuracy and credibility.
- Applying both methods to survey data, experiments, or interviews creates actionable, evidence-based insights.
Frequently Asked Questions
Q1: What are the main types of data analysis methods in research?
Quantitative methods handle numerical data, qualitative methods analyze text and narratives, and mixed methods combine both for richer insights.
Q2: How do I choose between descriptive and inferential statistics?
Descriptive statistics summarize existing data; inferential statistics predict trends or generalize findings to a population.
Q3: Can surveys use qualitative analysis?
Yes, open-ended survey responses benefit from content, thematic, or sentiment analysis, providing context to numerical results.
Q4: What software is best for survey analysis?
R and SPSS are best for advanced models, while Google Forms or SurveyMonkey work for basic frequency and visualization.
Q5: Why is data cleaning crucial before analysis?
Cleaning ensures accuracy by removing incomplete, speedy, or straightlined responses, preventing skewed results.
Turning Data Into Action
I’ve learned that mastering data analysis methods in research transforms overwhelming datasets into actionable insights. My tip: always combine the rigor of quantitative analysis with the nuance of qualitative insights. It’s the difference between seeing numbers and understanding behavior.
By applying these methods thoughtfully, you’ll not only interpret data—you’ll make it speak.